How To Clarify PageSpeed Insights For Clients
Table Of Contents
I look at some common pitfalls and problems with PageSpeed Insights, and show ways to correctly interpret the data it gives to help sites pass the Core Web Vitals
Recently, I've had more clients asking about their PageSpeed Insights score. They're concerned with the amount of red they see, and they want to know how we can get rid of it. This, in and of itself, is good. I'm glad that clients realize page load time is an important part of user experience. However, the problem here is Google pushes people to PSI without educating them on what the report data means. As a result, clients sometimes don't fully understand the information that PSI is giving them, and they jump to incorrect conclusions. To make matters worse, PSI itself can give incorrect and misleading data in its reports, adding to the misunderstanding.
Let's take a deep dive into some of the problems with PSI and ways to solve them.
PageSpeed Insights is not Core Web Vitals
Before we start, it's worth bringing up a common misconception. In May 2020, Google came out with its Core Web Vitals metrics. These three metrics are how Google calculates page load time as perceived by humans. At the same time, Google said these Core Web Vitals will be a ranking signal sometime soon. They added reports to Google Search Console so site owners can prepare their sites before the Big G starts using it as a ranking signal.
As a part of the Search Console reports, Google points people to PSI if their pages don't meet the CWV standards. This led to people thinking that PSI and its reports were the same as the Core Web Vitals, which is not true. The two tools do have some overlap; they share two metrics (Largest Contentful Paint and Cumulative Layout Shift), and they are both used to measure aspects of page load time. However, PSI includes four other metrics when calculating the scores, and CWV includes a third one (First Input Delay), which PSI can't measure. PSI is a tool for developers to decrease load time and improve user experience, but a good PSI score doesn't necessarily mean the page passes the CWV and vice versa.
Mobile PSI report
The most common problem with PSI is how it calculates network speed. The mobile report uses a simulated throttle, where the page is downloaded as if it was on a mobile network. According to the PSI docs, the mobile report is simulated with a throughput of 1.6Mbps down / 750Kbps up. However, looking at the US Speedtest report for 2019 by Ookla (the company behind speedtest.net), the average mobile throughput is 33.88Mbps down / 9.75Mbps up. I do understand that this depends on what country you're targetting. But for countries with similar mobile network speeds to the US, PSI's throttling is too slow.
To see how this looks in real life, I ran a PSI test on https://www.michigan.gov/. I chose this site because it's mainly visited by people in the US and has enough traffic for field data to be shown:
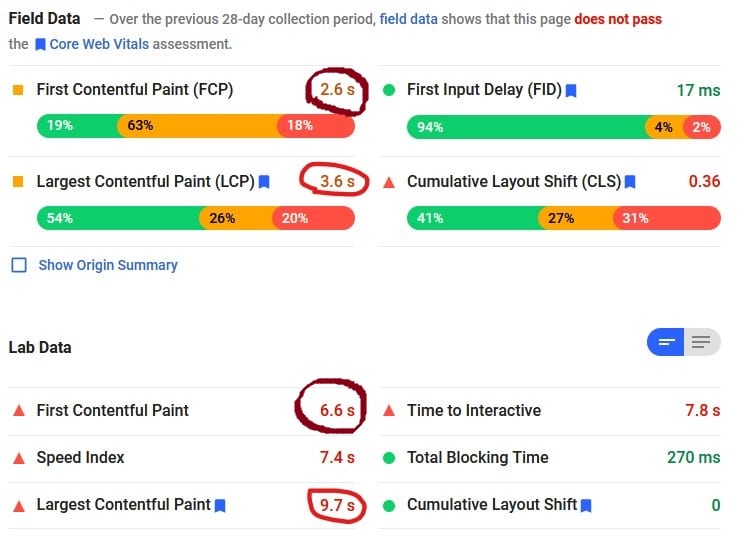
Quick tangent for those unfamiliar with what the Field Data and Origin Summary sections are. When you visit pages in Chrome, it sends timing reports to Google. PSI accesses these to give a view of what real-life load times are like. Field Data is specific to the page tested; Origin Summary is an average across all measured pages on the site.
Comparing the field data to the PSI results on mobile shows the difference. The two direct comparisons we can make are FCP and LCP. For both, the PSI result is around 2.5x slower than the real-life field data.
So, having the field data is very useful to show actual load times. The problem is that PSI only shows the field data if there are enough reports for a page. I'm not sure what the exact number is, but it's somewhere in the hundreds. For sites my company manages, only those with over 1,000 page views display field data.
Clarifying the mobile reports
For developers, there's a couple of places to find additional data. First, you can run the Lighthouse tests using Chrome. Canary has the most up to date version of Lighthouse, so it's best to use that. It's in the dev tools and comes with more realistic throttling speeds.
Second, Google provides the web-vitals JavaScript library to add to projects. It calculates all the metrics on each page load and you can store that data and use it.
Opportunities and Diagnostics
Below the scores and speeds, PSI has two sections: Opportunities and Diagnostics. These sections are meant to give more insight (ha) into why your page might be slow. But some of them are not necessarily accurate, and some more require more work to decide how much of an effect they actually have on page speed. I'm not going to look at all of them, but here are the most common two that I've seen.
Network payloads aren't always correct
In the diagnostic section, Google shows you the total download size of your page. Useful, right? Except it's not always accurate. Here's a PSI report from https://sawyer.com (chosen because I worked on this site, and they make really cool outdoors stuff).
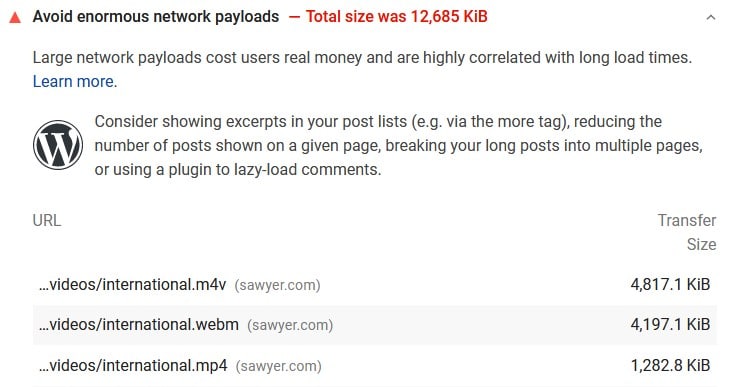
Does that page actually have three videos playing on it? No, it doesn't. Here's the code:
<video id="video-bg" class="video-wrap-embed" autoplay="autoplay" poster="" loop muted>
  <source src="https://sawyer.com/wp-content/themes/sawyer-2017-theme/videos/international.m4v" type="video/mp4">
  <source src="https://sawyer.com/wp-content/themes/sawyer-2017-theme/videos/international.webm" type="video/webm" />
  <source src="https://sawyer.com/wp-content/themes/sawyer-2017-theme/videos/international.mp4" type="video/mp4" />
</video>
If you don't understand the code above, the <video> tag displays videos on a
webpage. Inside the tag, there are three links to different types of video
files. Not all browsers and operating systems can play every type of video
file. Giving a choice of three different ones ensures that all browsers will be
able to play the video.
The issue here is that PSI added up the total of all three video files, even though browsers will only play one of the three. At worst, the actual network payload is 7,205.1 KiB, not 12,685 KiB, over 40% smaller than PageSpeed says! That's not only confusing and unhelpful, it's actually a completely incorrect data point.
If developers are pressured to fix this, they're left with two choices, neither of them good. They could reduce the quality to shrink the file size, making it look worse. Or they could only have one video file, which would be the smaller WebM format, making it unplayable in some browsers.
Again, these are fixes for a nonexistent problem. It's only a problem with PSI's incorrect calculation.
Unused CSS and JavaScript might not be unused
Another inaccuracy is the items titled "Remove unused JavaScript" and "Remove unused CSS". PSI attempts to determine how much of your CSS and JavaScript is being used on the page and shows you how much is not used. This can occasionally be useful, but it's often not. PSI doesn't do any interactive actions on the page (doesn't click buttons, fill out forms, scroll, etc). But interacting with the page is the only way some of the JS and CSS is ever used. Because PSI doesn't interact with it, it sees those pieces of JS/CSS as useless when, in fact, they are used. Here's those two sections of Sawyer's PSI report:
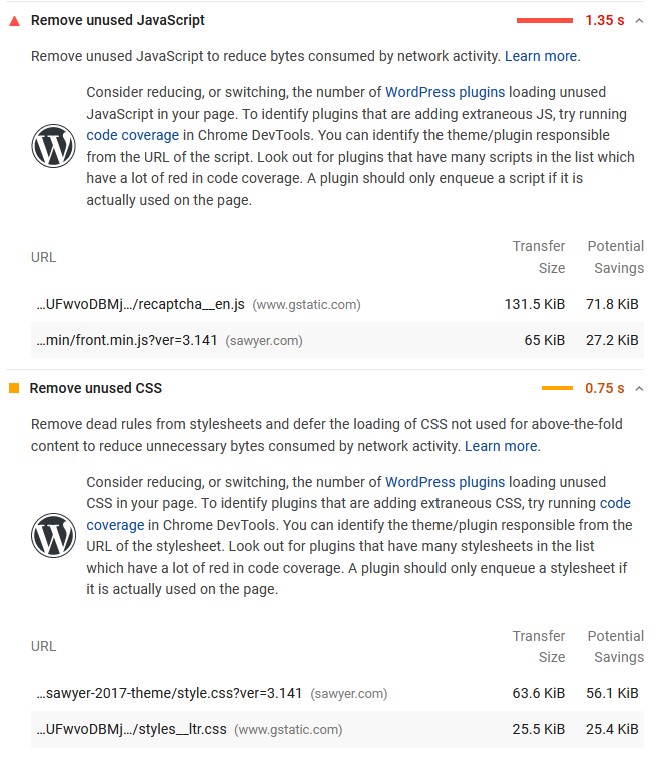
Before going further, I would like to point out that the most unused script and second most unused CSS file is from Google reCAPTCHA. If that surprises you, it shouldn't. Google has a long and storied history of breaking its own PageSpeed rules. Back in the olden days, PSI factored in cache times to the score. It was impossible to get a perfect score if you had Google Analytics or Tag Manager on your site because Google set those cache times too low, and PSI took away points for it.
But actually, reCAPTCHA is a great way to illustrate my point. PSI says there's a lot unused, but most of the scripts and some of the styles are only used when a user attempts to solve it. Since PSI doesn't attempt to solve the reCAPTCHA, it inaccurately counts those sections as unused.
Conclusion
As developers, we can't take all of the opportunities/diagnostic reports at face value. It's best to go through each one and fully check for inaccuracies. This takes some time, but if a client has questions, you will be ready to defend your decisions and develop a better plan for improving their site before the CWV becomes a ranking signal.